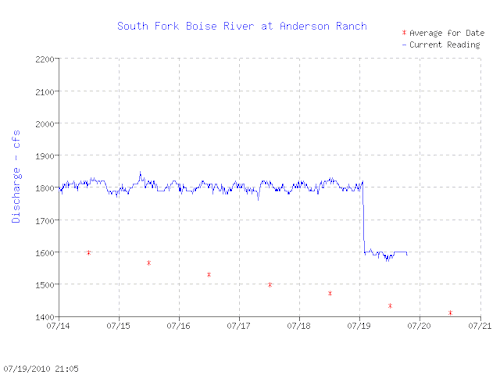


As far as water contents in Anderson Ranch reservoir are concerned, this year has been tracking with 2009 as seen in the third graph, but these lines should soon depart and the blue line will drop less steeply. If we go one month with 200 cfs less being released, and the flow releases stay the same through the fall, it means an extra 12,000 acre feet in Anderson as we approach winter. This amount of water means more in a pool that starts off with 220,000 acre feet and is trying to fill to 400,000 acre feet. If the pool is completely empty the 12,000 acre feet means less on a percentage basis.

Finally, the lasts graph shows the total reservoir contents in the Boise River system this year as compared to last year and the long term average. The water volume is tracking very close to last year. The drop in 200 cfs in Anderson may not mean as much at the level of a reservoir system that can store one million acre feet.
The implications for next year are unknown since we are very much a snow dependent reservoir system, but any extra amount going into the winter is always welcome.


